Exhibit 13.7
The following questions refer to the information and output below.
A tax accountant has found that the time to serve a customer has a mean of 30 minutes (or 0.5 hours) and a standard deviation of 6 minutes (or 0.1 hours). Customer arrivals follow a Poisson distribution with an average of 60 minutes between arrivals. The following queuing analysis spreadsheet was developed from this information. 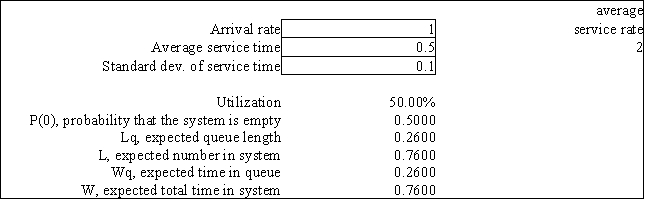
-Refer to Exhibit 13.7. Based on this report what is the probability that a customer does not have to wait for assistance with his or her taxes?
Definitions:
Q13: The best-case analysis approach to risk analysis<br>A)
Q15: Refer to Exhibit 10.2. What percentage of
Q25: Money extracted to penalize wrongdoers and deter
Q40: Refer to Exhibit 11.12. What are predicted
Q45: The restorative justice approach known as peacemaking
Q46: Refer to Exhibit 11.9. What is the
Q46: Which of the following best describes a
Q54: Using the information in Exhibit 12.3, what
Q56: Sensitivity analysis is most useful in<br>A) decision-making
Q98: The decision with the smallest expected opportunity