Multiple Choice
Table 5-7
The following table shows a portion of the demand schedule for a particular good at various levels of income. 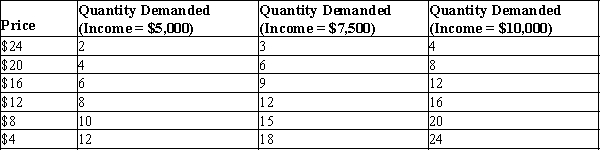
-Refer to Table 5-7. Using the midpoint method, at a price of $16, what is the income elasticity of demand when income rises from $5,000 to $10,000?
Definitions:
Related Questions
Q19: Assume that a 4 percent increase in
Q145: For a particular good, a 5 percent
Q186: If income rises in the market for
Q218: Necessities such as food and clothing tend
Q282: Given the market for illegal drugs, when
Q292: Cross-price elasticity of demand measures how the
Q314: Refer to Table 5-3. Using the midpoint
Q429: An increase in the price of cheese
Q477: Which of the following observations would be
Q505: Refer to Figure 6-15. Suppose a price