Multiple Choice
Figure 10-1 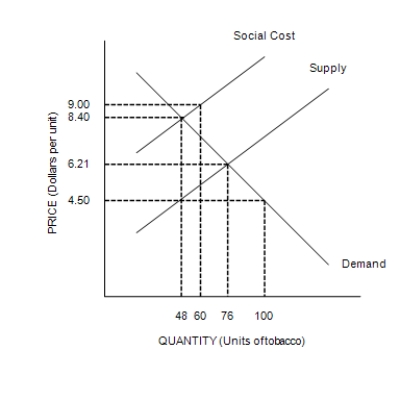
-Refer to Figure 10-1. This graph represents the tobacco industry. The industry creates
Definitions:
Financial Capital
Economic resources measured in terms of money used by entrepreneurs and businesses to buy what they need to make their products or to provide their services.
Related Questions
Q82: In the case of a technology spillover,
Q182: Honduras is an importer of goose-down pillows.
Q213: When a country that imports shoes imposes
Q233: Suppose Iceland goes from being an isolated
Q234: If a small country imposes a tariff
Q242: When the nation of Worldova allows trade
Q305: Since World War II, GATT has been
Q408: When a nation first begins to trade
Q430: Refer to Figure 10-6. Which quantity represents
Q482: Which of the following is NOT a