Table 10-5
The following table shows the marginal costs for each of four firms (A, B, C, and D) to eliminate units of pollution from their production processes. For example, for Firm A to eliminate one unit of pollution, it would cost $54, and for Firm A to eliminate a second unit of pollution it would cost an additional $67. 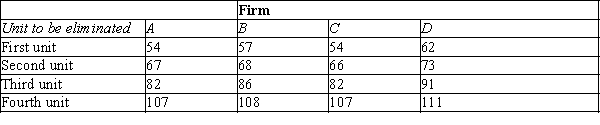
-Refer to Table 10-5. Suppose the government wants to reduce pollution from 16 units to 8 units and auctions off 8 pollution permits to achieve this goal. Which of the following is a likely auction price of the permits?
Definitions:
Supply Of Loanable Funds Curve
A graphical representation showing the relationship between the interest rate and the total amount of savings available for lending in the financial market.
Demand For Loanable Funds Curve
The demand for loanable funds curve illustrates the relationship between the interest rate and the quantity of loanable funds demanded by borrowers, showing how borrowing can decrease as interest rates rise.
Interest Rate
The amount charged by lenders to borrowers for the use of money, expressed as a percentage of the principal, usually on an annual basis.
Loanable Funds
The funds in financial institutions that are available for borrowing.
Q27: Refer to Figure 9-24. With free trade,
Q90: Refer to Figure 10-2. The private value
Q232: Who among the following is a free
Q283: Which of the following problems can not
Q287: If we know that the supply curve
Q348: Refer to Figure 9-25. With free trade
Q349: Policymakers often consider trade restrictions in order
Q416: Why is the commercial value of ivory
Q418: A benevolent social planner would prefer that
Q508: When market activity generates a negative externality,