Multiple Choice
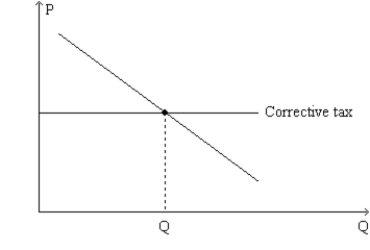
Figure 10-18. The graph represents a corrective tax to reduce pollution. On the axes, Q denotes the quantity of pollution and P represents the price of pollution. 
-Refer to Figure 10-18. The tax depicted on the graph
Definitions:
Related Questions
Q50: Two firms, A and B, each currently
Q80: Refer to Figure 9-24. Suppose the government
Q114: Refer to Figure 9-26. Suppose the world
Q119: Using the graph, assume that the government
Q175: Refer to Figure 10-10. A decrease in
Q179: The idea of requiring motorists to pay
Q225: Suppose that the cost of installing an
Q285: Refer to Scenario 10-1. Let QMARKET represent
Q336: Without government intervention, public goods tend to
Q447: Suppose the government imposes a tax in