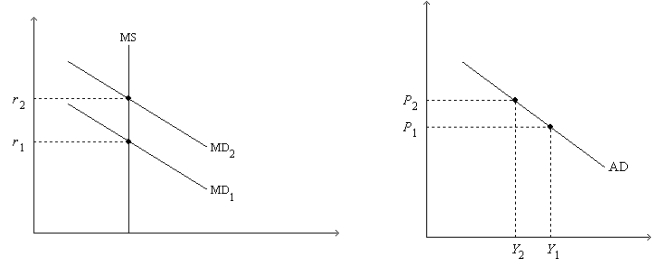
Figure 34-2. On the left-hand graph, MS represents the supply of money and MD represents the demand for money; on the right-hand graph, AD represents aggregate demand. The usual quantities are measured along the axes of both graphs.

-Refer to Figure 34-2. As we move from one point to another along the money-demand curve MD1,
Definitions:
Operating Income
Earnings from a company's primary business activities, excluding costs and expenses related to financing and investments.
Net Working Capital
An assessment of a corporation's short-term financial health, derived by taking current assets and deducting current liabilities.
Sales Volume
The total number of units sold within a specified time frame, an indicator of a company's performance and market demand for its product or service.
Q86: Economists mostly agree that the Great Depression
Q171: According to liquidity preference theory, the money-supply
Q195: Other things the same, what happens in
Q197: If wages are sticky, then a greater
Q222: The interest-rate effect<br>A) depends on the idea
Q250: People will want to hold more money
Q254: Refer to Figure 33-5. Starting from point
Q337: Suppose a country offers a new investment
Q346: Refer to Figure 34-6. Suppose the multiplier
Q475: An increase in government spending on goods