Figure 34-6. On the left-hand graph, MS represents the supply of money and MD represents the demand for money; on the right-hand graph, AD represents aggregate demand. The usual quantities are measured along the axes of both graphs.
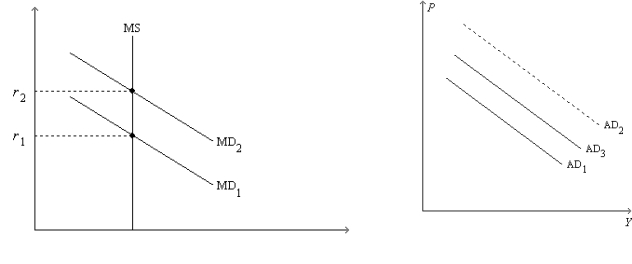
-Refer to Figure 34-6. Suppose the multiplier is 5 and the government increases its purchases by $15 billion. Also, suppose the AD curve would shift from AD1 to AD2 if there were no crowding out; the AD curve actually shifts from AD1 to AD3 with crowding out. Also, suppose the horizontal distance between the curves AD1 and AD3 is $55 billion. The extent of crowding out, for any particular level of the price level, is
Definitions:
Stock Market Crash
A sudden and significant decline in the value of stock market shares, often leading to widespread financial panic and economic downturn.
Business Person
An individual who is involved in the activities of running or managing a business, which may range from a small enterprise to a large corporation, focusing on profit-making strategies.
Anomic Suicide
Results from a lack of regulation of the individual when the norms governing existence no longer control that individual.
Suicide Rates
The statistical measures representing the number of suicide deaths in a specific population and time period.
Q7: In 2014,foreign purchases of U.S.corporate stocks and
Q27: In the short run,<br>A) the price level
Q95: According to liquidity preference theory, if the
Q153: The goal of monetary policy and fiscal
Q183: Government expenditures on capital goods such as
Q188: A 2009 article in The Economist noted
Q406: Refer to Figure 34-2. What does Y
Q467: are changes in fiscal policy that stimulate
Q507: Consider the following sequence of events: price
Q558: Suppose a boom in stock market prices