Figure 34-6. On the left-hand graph, MS represents the supply of money and MD represents the demand for money; on the right-hand graph, AD represents aggregate demand. The usual quantities are measured along the axes of both graphs.
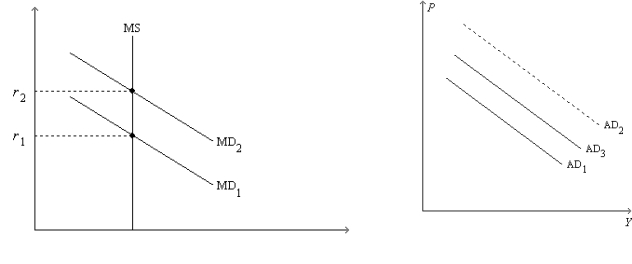
-Refer to Figure 34-6. Suppose the graphs are drawn to show the effects of an increase in government purchases. If it were not for the increase in r from r1 to r2, then
Definitions:
Pay Accounts Promptly
The practice of settling owed amounts to suppliers or creditors within the agreed payment terms to avoid late fees and maintain good business relationships.
Merchandising Company
A business that purchases finished goods for resale, making profit primarily through the markup of these goods.
Income Summary Account
An account used temporarily during the closing process to summarize a period's revenues and expenses before determining net income.
Determination Of Income
The process of calculating the income of a business or individual, considering all sources of revenue and applicable expenses.
Q3: If households view a tax cut as
Q11: The short-run effects on the interest rate
Q103: During what period of time did the
Q104: Which of the following properly describes the
Q126: Refer to Figure 34-11. The economy is
Q223: Why might a country raise interest rates
Q249: In the long-run, an increase in aggregate
Q264: Which of the following statements generates the
Q307: Fiscal policy affects the economy<br>A) only in
Q478: For the U.S. economy, which of the