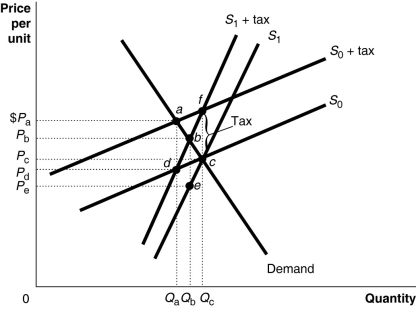
 Figure 18-2 shows a demand curve and two sets of supply curves,one set more elastic than the other.
-Refer to Figure 18-2.If the government imposes an excise tax of $1.00 on every unit sold
Definitions:
Product Alpha
A term often used to define the first version or iteration of a product, typically before it is released to the general public for feedback.
Marginal Utility
The additional satisfaction or utility that a person receives from consuming one more unit of a good or service.
Utility-Maximizing Rule
An economic principle stating that consumers allocate their income to purchase the combination of goods and services that maximizes their utility.
Consumption Mix
The combination of goods and services consumed by an individual or in an economy, reflecting preferences, income levels, and other factors.
Q6: If you pay $3,000 in taxes on
Q7: The collection and analysis of massive amounts
Q32: What is the difference between the nominal
Q84: An increase in the supply of capital,which
Q93: What are the three most important variables
Q115: Refer to Table 18-1.Suppose a series of
Q207: Income inequality increases as the Gini coefficient
Q210: Suppose that a price-discriminating producer divides its
Q240: Refer to Table 19-31.The table above represents
Q251: A study by the Congressional Budget Office