Multiple Choice
Figure 18-6
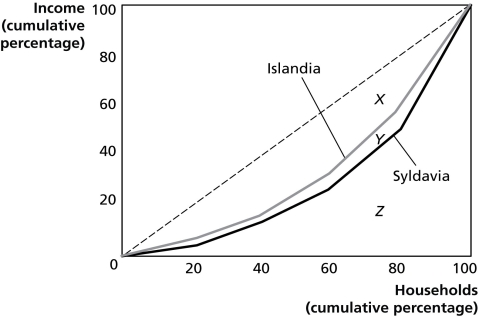
Figure 18-6 shows the Lorenz curves for Islandia and Syldavia.
-Refer to Figure 18-6.If area X = 2,060, area Y = 240, and area Z = 2,700, calculate the Gini coefficient for Islandia.
Definitions:
Related Questions
Q35: Unlike the market process,in the political market
Q73: Let MP = marginal product,P = output
Q160: A country in which a significant fraction
Q175: The labor supply curve<br>A)shows the relationship between
Q183: Which of the following is not a
Q206: The public choice model asserts that the
Q219: The total value to society of having
Q236: Refer to Scenario 17-1.Following the passage of
Q237: Why do professional basketball players earn more
Q261: Marginal revenue product of labor for a