Figure 18-6
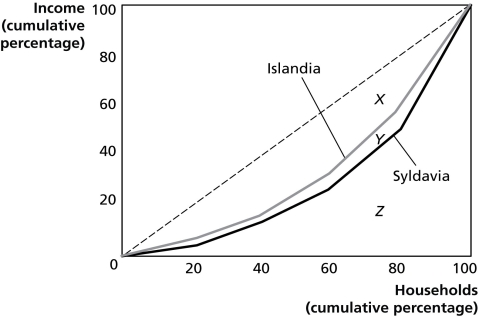
Figure 18-6 shows the Lorenz curves for Islandia and Syldavia.
-Refer to Figure 18-6.If area X = 2,060, area Y = 240, and area Z= 2,700, calculate the Gini coefficient for Syldavia.
Definitions:
Basic Development Projects
Initiatives aimed at foundational improvements in an economy or society, such as infrastructure, education, and health services.
Developing Nations
Countries with a lower level of material well-being, lower income per capita, and generally striving to achieve higher levels of economic and social development.
Economists
Professionals who study and analyze the production, distribution, and consumption of goods and services.
Economic Development
Refers to the process by which a country improves the economic, political, and social well-being of its people.
Q12: Which of the following is used to
Q50: The application of economic analysis to human
Q76: Refer to Table 17-1.The marginal product of
Q122: For the top 1 percent of income
Q172: Refer to the Article Summary.If Netflix chose
Q172: A marginal tax rate is calculated as<br>A)total
Q173: To calculate GDP using the value-added method,one
Q191: What is yield management? How is yield
Q222: Today,Walt Disney World charges different customers different
Q227: Refer to Figure 18-2.If the government imposes