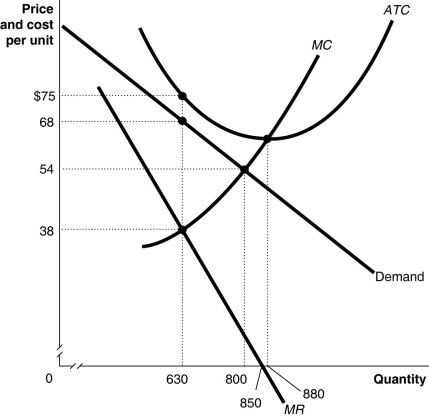
Figure 15-3

Figure 15-3 above shows the demand and cost curves facing a monopolist.
-Refer to Figure 15-3.Suppose the monopolist represented in the diagram above produces positive output.What is the price charged at the profit-maximizing/loss-minimizing output level?
Definitions:
Continuous Variable
A variable that can take on an infinite number of values within a given range, allowing for any value within its interval.
Factor
An element or component that contributes to a result or outcome, often used in statistics and analysis.
ANOVA
ANOVA, or Analysis of Variance, is a statistical method used to test differences between two or more means by analyzing variation within and between groups.
Means
Refers to the arithmetic average of a set of numbers, calculated as the sum of the numbers divided by the count of those numbers.
Q1: Which of the following is an example
Q41: The demand curve for a monopoly's product
Q49: When a firm faces a downward-sloping demand
Q55: Which of the following is not a
Q60: The equilibrium in the prisoner's dilemma is
Q139: Explain the differences between total revenue,average revenue,and
Q166: Whenever a firm can charge a price
Q204: If price discrimination occurs in a market<br>A)the
Q213: Refer to Figure 15-3.What happens to the
Q230: In the 1930s and 1940s,the Technicolor company