Figure 15-4
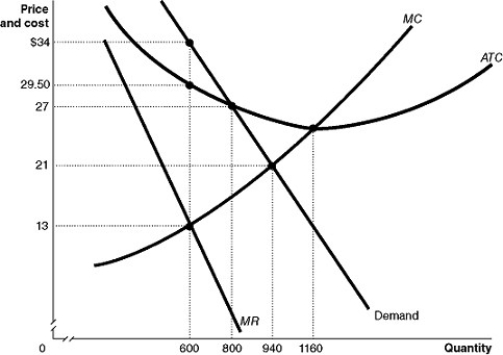
Figure 15-4 shows the demand and cost curves for a monopolist.
-Refer to Figure 15-4.What is the profit-maximizing/loss-minimizing output level?
Definitions:
Effect Size
An objective, standardized way of describing the strength of the independent variable’s influence on the dependent variable.
P Value
A statistical measure that helps scientists determine the significance of their research results.
Standard Deviation
A measure of the amount of variation or dispersion of a set of values, indicating how much the values differ from the mean.
Descriptive Statistics
Statistical procedures that organize and summarize research data.
Q22: Refer to Figure 16-6.With this pricing scheme
Q52: Cost-plus pricing may be a reasonable way
Q84: Refer to Table 14-5.Does Henri have a
Q92: Which of the following is a reason
Q131: Cost-plus pricing would be consistent with selecting
Q151: Compared to a competitive market,a firm that
Q158: If we use a narrow definition of
Q222: Each member of OPEC can increase its
Q244: The Herfindahl-Hirschman Index is one factor used
Q253: From an economic perspective,price discrimination is desirable