Figure 13-10
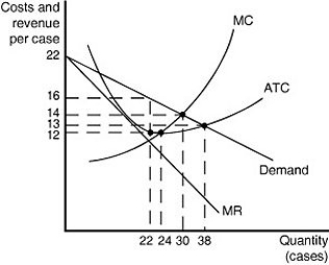
Figure 13-10 shows cost and demand curves for a monopolistically competitive producer of iced tea.
-Refer to Figure 13-10.to answer the following questions.
a.What is the profit-maximizing output level?
b.What is the profit-maximizing price?
c.At the profit-maximizing output level, how much profit will be realized?
d.Does this graph most likely represent the long run or the short run? Why?
Definitions:
Distribution Channels
Networks or pathways through which goods and services flow from producers to consumers, including wholesalers, retailers, and direct-sales mechanisms.
Manufactured Product
Products that have been processed or made from raw materials through industrial processes.
Product Adaptation
The process of modifying a product to suit the needs or preferences of a particular market or set of consumers, often necessary for success in international markets.
Global Marketing
Strategies aimed at creating, placing, and promoting products and services in worldwide markets.
Q2: Arnold Harberger was the first economist to
Q53: A firm's total profit can be calculated
Q53: Which of the following is a factor
Q66: If a monopolistically competitive firm breaks even,the
Q89: The "Discount Department Stores" industry is highly
Q98: Refer to Figure 13-9.Which of the graphs
Q197: Apple introduced its iPhone 3G in July
Q207: A four-firm concentration ratio measures<br>A)the fraction of
Q222: Refer to Table 13-4.Based on the data
Q322: When a firm produces more output using