Figure 12-5
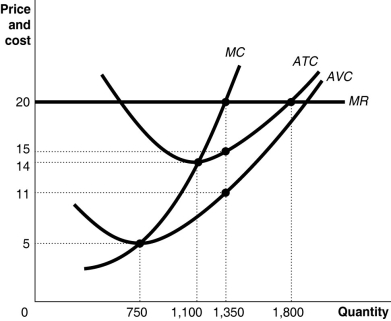
Figure 12-5 shows cost and demand curves facing a typical firm in a constant-cost, perfectly competitive industry.
-Refer to Figure 12-5.The firm's manager suggests that the firm's goal should be to maximize average profit.In that case, what is the output level and what is the average profit that will achieve the manager's goal?
Definitions:
Q19: Which of the following statements is true?<br>A)The
Q69: The marginal product of labor is calculated
Q71: What is always true at the quantity
Q129: An explicit cost is defined as<br>A)a cost
Q141: In the long-run equilibrium,a monopolistically competitive firm
Q210: Which of the following statements regarding a
Q213: If a firm produces 20 units of
Q220: If a monopolistically competitive firm lowers its
Q222: Long-run cost curves are U-shaped because<br>A)of the
Q315: You own a business that answers telephone