Figure 12-17 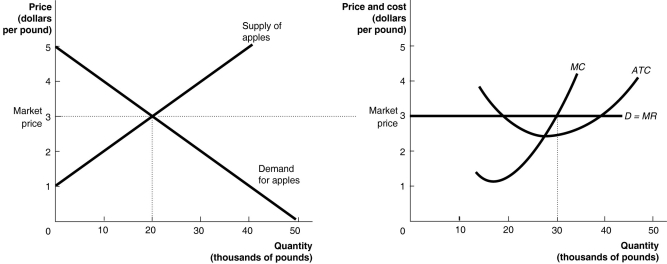 The graphs in Figure 12-17 represent the perfectly competitive market demand and supply curves for the apple industry and demand and cost curves for a typical firm in the industry.
-Refer to Figure 12-17. Which of the following statements is true?
Definitions:
Q12: Juicy Couture has been successful in selling
Q28: What is the profit-maximizing rule for a
Q74: If the market price is $25 in
Q138: If a firm shuts down it<br>A)will suffer
Q173: Consumers benefit from monopolistic competition by<br>A)being able
Q204: Refer to Figure 13-11.What is the productively
Q245: Which of the following describes a difference
Q264: If an airport decides to expand by
Q272: Arturo runs a Taco Bell franchise.He is
Q278: Which of the following statements is true?<br>A)Opportunity