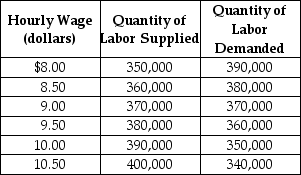
Table 4-8
 Table 4-8 shows the demand and supply schedules for the low-skilled labor market in the city of Westover.
-Refer to Table 4-8. Suppose that the quantity of labor demanded increases by 40,000 at each wage level. What are the new free market equilibrium hourly wage and the new equilibrium quantity of labor?
Definitions:
Financial Assistance
Monetary support provided to individuals or organizations, often aimed at helping cover costs or expenses.
Navigation Bar
A user interface component consisting of clickable links or buttons, allowing users to easily navigate through a website or application.
Home Page
The main or starting page of a website, which typically provides navigation to other sections of the site.
Landscape Management
The practice of designing, implementing, and maintaining outdoor environments to ensure they are sustainable, functional, and aesthetically pleasing.
Q73: A tragedy of the commons occurs when
Q124: If,in a competitive market,marginal benefit is greater
Q124: For certain public projects such as building
Q136: The marginal cost for Java Joe's to
Q216: Refer to Table 3-3.The table above shows
Q225: Which of the following exemplifies the tragedy
Q237: Which of the following conditions holds in
Q254: A surplus occurs when the actual selling
Q300: The total amount of consumer surplus in
Q369: The division of the burden of a