Table 4-8
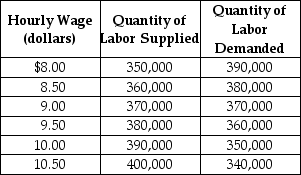 Table 4-8 shows the demand and supply schedules for the low-skilled labor market in the city of Westover.
-Refer to Table 4-8. Suppose that the quantity of labor demanded decreases by 40,000 at each wage level. What are the new free market equilibrium hourly wage and the new equilibrium quantity of labor?
Definitions:
Intermediate-Range Plans
Planning activities that cover a time frame from 3 months to 1 year, focusing on allocations of resources and objectives in the medium term.
Perishable Inventory
Items in inventory that have a limited shelf life and therefore require more dynamic and sensitive handling, management, and forecasting strategies to minimize losses due to spoilage.
Disaggregation
The process of breaking down a complex system or data set into smaller, more manageable parts.
Master Production Schedule
A detailed plan that outlines what a business needs to produce, how much, and when, over a certain period.
Q9: When there is an externality in a
Q52: Economists working at federal government agencies have
Q109: Draw a demand curve and label it
Q143: The area above the market supply curve
Q155: Refer to Figure 3-2.An increase in the
Q159: The phrase "demand has increased" means that<br>A)a
Q233: An advantage of imposing a tax on
Q311: The law of demand implies,holding everything else
Q312: Refer to Table 4-13.The equations above describe
Q414: Quantity supplied refers to the amount of