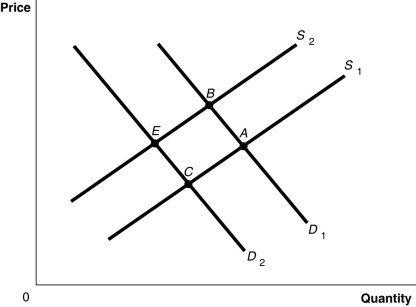
Figure 3-8 
-Refer to Figure 3-8.The graph in this figure illustrates an initial competitive equilibrium in the market for sugar at the intersection of D1 and S2 (point B) .If there is an decrease in the price of fertilizer used on sugar cane and there is a decrease in tastes for sugar-sweetened soft drinks,how will the equilibrium point change?
Definitions:
Financial Institutions
Organizations that provide financial services, such as banks, insurance companies, and stock exchanges.
Market Prices
The existing rate at which a service or asset is offered for buying or selling in the market environment.
Efficiency
The extent to which assets, resources, and time are used effectively to achieve a desired outcome, often measured in terms of output per input.
Semi-strong Form
A concept in efficient market hypothesis proposing that all publicly available information is fully reflected in stock prices.
Q48: At a product's equilibrium price<br>A)the product's demand
Q71: Refer to Figure 2-13.Which country has a
Q142: If the price of garlic is represented
Q172: Which of the following would cause the
Q184: An increase in input costs in the
Q226: When you purchase a new pair of
Q268: Which of the following has occurred as
Q287: Suppose that when the price of ice
Q416: Refer to Figure 4-18.What is the size
Q491: Refer to Table 2-9.What is Serena's opportunity