Multiple Choice
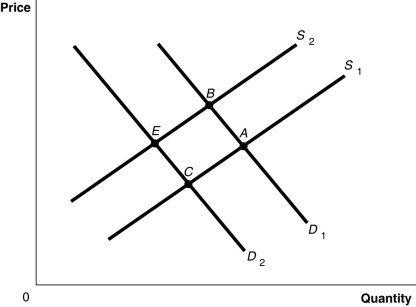
Figure 3-8 
-Refer to Figure 3-8.The graph in this figure illustrates an initial competitive equilibrium in the market for motorcycles at the intersection of D2 and S1 (point C) .Which of the following changes would cause the equilibrium to change to point B?
Definitions:
Related Questions
Q12: The division of the burden of a
Q67: Let D = demand,S = supply,P =
Q129: Refer to Figure 3-8.The graph in this
Q147: Refer to Figure 4-15.For each unit sold,the
Q172: Which of the following would cause the
Q239: Refer to Table 2-16.Finland has a comparative
Q245: A decrease in population shifts the production
Q263: Refer to Figure 4-21.The figure above represents
Q295: In April,market analysts predict that the price
Q439: If the price of peaches,a substitute for