Figure 2-15 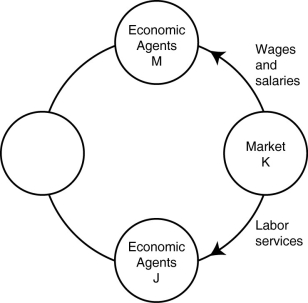
-Refer to Figure 2-15. In the circular flow diagram, economic agents M represent
Definitions:
Protection-As-A-Bargaining-Chip
A strategic use of trade barriers or policies by a country to gain concessions or favorable terms from other countries.
Consumer Surplus
The difference between what consumers are willing to pay for a good or service versus what they actually pay.
Producer Surplus
The difference between the amount producers are willing and able to sell a good for and the actual amount received by them when the good is sold at the market price.
Comparative Advantage
The capacity of a person or collective to conduct a specific economic operation more effectively compared to another.
Q66: Which of the following are primarily macroeconomic
Q124: Scarcity<br>A)stems from the incompatibility between limited resources
Q160: Damian shares a small food truck with
Q189: Refer to Table 2-17.Which of the following
Q247: Refer to Figure 2-4.Consider the following events:
Q260: Which of the following is a microeconomics
Q261: Refer to Figure 2-14.Which country has a
Q286: In the circular flow model,households demand resources
Q413: Which of the following is a problem
Q468: Izzy Amador is a highly talented tattoo