The figure given below depicts the demand and supply of Brazilian reals in the foreign exchange market.Assume that the market operates under a flexible exchange rate regime. Figure 36.1 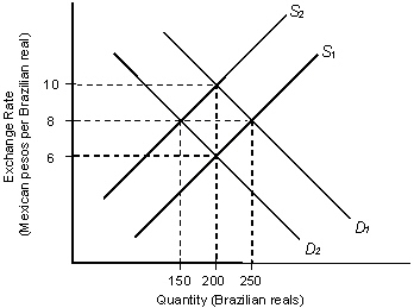 In the figure:
D1 and D2: Demand for Brazilian reals
S1 and S2: Supply of Brazilian reals
Refer to Figure 36.1.The demand curves shown for Brazilian reals are based on:
Definitions:
High-Risk
Describing investments or entities that offer the potential for higher returns but with a higher likelihood of loss or volatility.
Low-Risk
Refers to investments or financial situations that are expected to have a minimal chance of loss or decrease in value.
ROA
Return on Assets, a financial metric that shows the profitability of a company in comparison to its overall assets.
Dividend Payout Ratio
The percentage of earnings paid to shareholders in dividends, calculated as dividends per share divided by earnings per share.
Q31: The figure below shows the demand (D)and
Q79: Arlene quits her $125,000-a-year job to take
Q80: A Gini of 0 implies:<br>A)every family has
Q87: Suppose a U.S.citizen invests $1, 000 to
Q104: The 45-degree line splitting the distance between
Q137: Refer to Table 1-6.What is Ivan's marginal
Q209: "The distribution of income should be left
Q267: What is an economic market?
Q306: If a straight line passes through the
Q314: Which of the following is not an