The figure given below depicts the foreign exchange market for British pounds traded for U.S.dollars. Figure 36.2 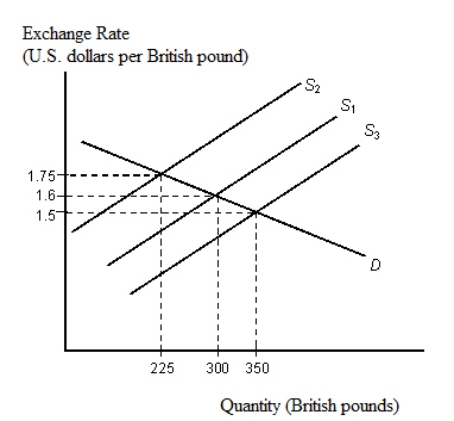 Refer to Figure 36.2.Suppose that the British central bank wishes to maintain a fixed exchange rate of £1 = $1.60.If supply decreases from S1 to S2, the bank must:
Definitions:
Diminishing
The process of lessening or decreasing in size, importance, or intensity.
Output
The quantity of goods or services produced by a business, individual, machine, or industry over a specified period.
Marginal Costs
Marginal costs refer to the increase or decrease in the total cost of producing one more unit of a good or service.
Marginal Productivity
The additional output that results from employing one more unit of input, such as labor or capital, while keeping other inputs constant.
Q32: The greater the negative income tax imposed
Q38: What is a marginal cost?
Q46: Consider the following statements: <br>A.Soda drinkers purchase
Q58: While it is possible to erect barriers
Q73: The following table shows that in one
Q121: Which of the following is an example
Q187: Refer to Table 1-6.What is Ivan's marginal
Q235: The basic economic problem of scarcity<br>A)has always
Q272: The sales revenue a seller receives from
Q410: An economic model is a simplified version