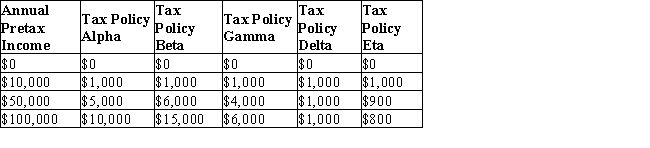
The table given below shows the absolute tax amounts under five different tax policies for respective income levels.Table 19.2
-The farther the Lorenz curve from the line of perfect equality, the lower is the income inequality.
Definitions:
Birth Order
The chronological order of sibling births in a family, which is believed to influence personality and behavioral traits.
Cohorts
Groups of people banded together or treated as a group, often used to refer to a category of people who share a common demographic or statistical characteristic within a specified time frame, such as birth year.
Cross-Sectional Studies
Research methods that analyze data from a population, or a representative subset, at a specific point in time.
Midlife Transition
A period typically occurring in middle adulthood when individuals reassess their life goals, achievements, and direction, often leading to significant life changes or adjustments.
Q6: The figure below shows two Lorenz curves,
Q41: Which of the following is true of
Q46: According to the Bureau of Labor Statistics,
Q54: Assume an Australian importer expects to pay
Q68: Under the negative income tax program, a
Q74: The figure given below depicts the negatively
Q105: Illegal immigrants to the U.S.usually charge higher
Q107: The value of the marginal product of
Q109: Disparate treatment refers to:<br>A)the treatment of individuals
Q126: The euro floats against other currencies, but