The figure given below shows the demand curve in the U.S.and the cost curves in U.S.and India. Figure: 29.4 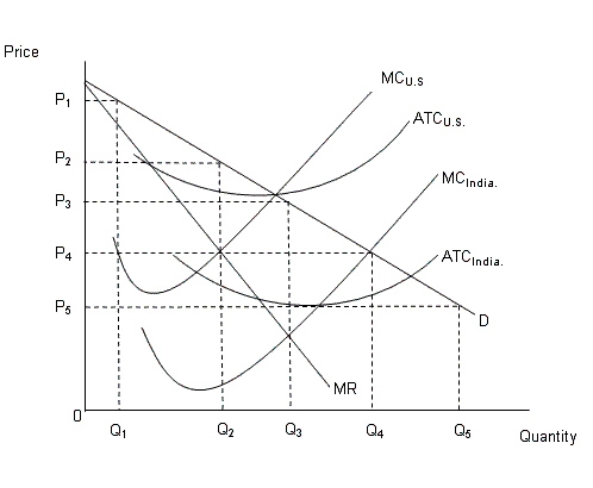 In the figure:
MC: Marginal cost curve
ATC: Average total cost curve
D: Demand curve in the U.S.
MR: Marginal revenue curve in the U.S.
In Figure 29.4, the price and quantity of the good if produced by India would be _____ and _____ respectively.
Definitions:
Tropical Deforestation
The clearing away of tropical forests due to logging, agriculture, or other human activities, leading to significant ecological and environmental consequences.
Global Warming
The gradual increase in Earth's average surface temperature, attributed to the greenhouse gas emissions from human activities such as fossil fuel burning and deforestation.
Ecological Services
The benefits that natural ecosystems provide to humans, such as clean water, air purification, pollination of crops, and climate regulation.
Human Exploitation
The unethical or unfair use of the labor and resources of people, often leading to harm or disadvantage.
Q5: If there is imperfect competition in the
Q6: Which of the following statements about employer
Q7: An increase in demand for housing will
Q22: Which of the following is a myth
Q42: The allocations of goods and services from
Q46: Which of the following is a measure
Q50: Which of the following is a true
Q58: Any terms of trade within the limits
Q91: All of the following will shift the
Q106: Why is each firm in a monopolistically