The following figure represents the equilibrium in the labor markets. Figure 28.4 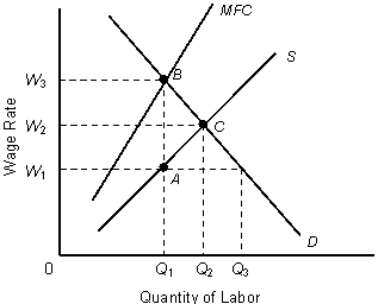 In the figure,
MFC: Marginal Factor Cost curve
D: Demand or the Marginal Revenue Product curve
S: Supply curve
Refer to Figure 28.4.If the government imposes a minimum wage of W2, how many units of labor will a monopsonist hire?
Definitions:
Income Summary
An account used in the closing process that summarizes the revenue and expenses for a specific accounting period.
Expenses Accounts
Accounts that track money spent or costs incurred in a company’s operations to generate revenue.
Rent Expense
The cost incurred for utilizing a property or equipment for business purposes, recognized as an expense in the accounting period it is incurred.
Net Income
The company's net income following the deduction of all costs and taxes from the total income.
Q9: The table given below shows the absolute
Q21: Many doctors, lawyers, and economists opine that
Q24: The European Union Emission Trading Scheme is
Q27: A regulated monopoly is a monopoly which
Q33: Risk is typically measured:<br>A)by comparing the size
Q86: The marginal-factor cost (MFC)is the:<br>A)value of the
Q101: Perfect competition provides one model in which
Q101: The table given below shows the annual
Q105: Goods which are demanded to produce something
Q111: Strategic behavior occurs when a firm takes