The figure given below shows the demand for permits and the maximum permissible level of pollution. Figure 13.4 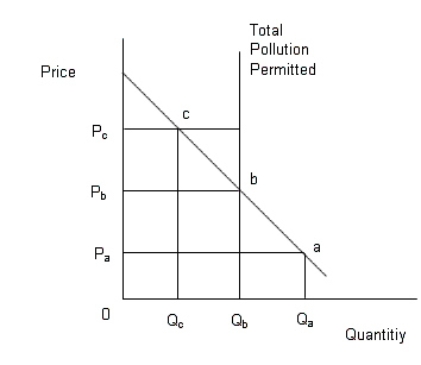 In the figure,
The downward sloping line is the demand curve of permits;
The vertical line denotes the maximum permissible limit of pollution.
Refer to Figure 13.4.Suppose the government wishes to reduce pollution to a quantity of Qb.If it sells marketable pollution permits at a quantity of Qb then:
Definitions:
Nominal Wages
The amount of money paid to employees before adjustments for inflation, representing the face value of wages at the time they are paid.
Price Level
A measure of the average prices of goods and services in an economy at a given point in time.
Real Wages
Income from work adjusted for the inflation rate, indicating the true buying power of the earnings.
Profit-Maximizing Wage
The wage level at which a firm maximizes its profits by balancing the cost of labor with productivity.
Q10: The S&P 500 index includes the stocks
Q24: A firm that was initially a monopsonist
Q24: An investment that has the same features,
Q36: The existence of new drugs reduces the
Q37: The policy of comparable worth has been
Q47: The price of Amazon.com stock was very
Q52: At an output level above the profit-maximizing
Q54: The American Medical Association restricts advertising by
Q77: On August 5, 2003, a tragic fire
Q96: The table given below shows the price