In the following figure, the first panel shows a market situation prior to regulation and the second panel shows the effects of regulation. Figure 26.2 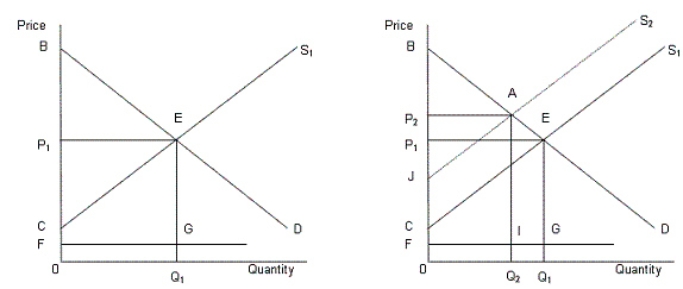 In the figure,
D: Demand curve for automobiles
S1: Supply curve of automobiles prior to regulation
S2: Supply curve of automobiles after regulation
FG: Clean up cost per unit
Refer to Figure 26.2.The regulation will benefit the society if:
Definitions:
Dividend Payout Ratios
Dividend payout ratios represent the percentage of a company's earnings paid out to shareholders as dividends, indicating how much money a company returns to shareholders versus retaining it.
High-Growth Firms
Companies that show significantly higher rates of growth in revenue or earnings than the average for their industry or the market as a whole.
Information Content
Information content refers to the degree to which a piece of information can impact an individual's understanding or the market's perception, often used in the context of how financial disclosures affect stock prices.
Q21: The following table shows the units of
Q23: The table given below shows the prices
Q30: The figure given below shows the revenue
Q36: If all the firms in a monopolistically
Q47: A firm employing secretaries and steelworkers should
Q69: Economic freedom refers to the freedom of
Q70: Price discrimination is best described as a
Q72: As the total quantity of land is
Q76: Scenario 22.1 Jane left her job at
Q99: Strategic behavior occurs when:<br>A)there are a large