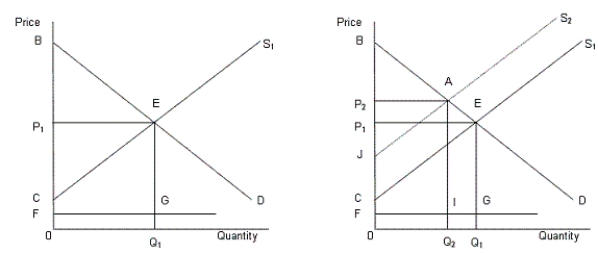
In the following figure, the first panel shows a market situation prior to regulation and the second panel shows the effects of regulation.Figure 14.2
 In the figure,
D: Demand curve for automobiles
S1: Supply curve of automobiles prior to regulation
S2: Supply curve of automobiles after regulation
FG: Clean up cost per unit
-If there are 50 firms in the industry, and each have an equal market share, the Herfindahl index will be equal to 1,00,000.
Definitions:
Covariance
A measure that indicates the extent to which two securities move in the same or opposite directions.
Stock Selection Return
The return achieved by an investor that can be attributed to the specific stocks chosen for investment, rather than the overall market movement.
Cross Border Fund
An investment fund that seeks to invest in assets located in countries other than where the fund is domiciled.
Benchmark
A standard or point of reference against which things may be compared or assessed, often used in investing to measure the performance of securities or portfolios.
Q2: If the current shareholders begin to believe
Q21: The table given below shows the total
Q28: If resource A and resource B are
Q53: The possible returns to a share holder
Q54: The face value of a bond is:<br>A)the
Q89: The market-demand curve for a product in
Q95: People leave their home country and go
Q109: Disparate treatment refers to:<br>A)the treatment of individuals
Q109: If an industry experiences economies of scale
Q119: If the marginal cost exceeds the marginal