The following figures show the demand and cost curves of a perfectly competitive and a monopoly firm respectively. Figure 24.7 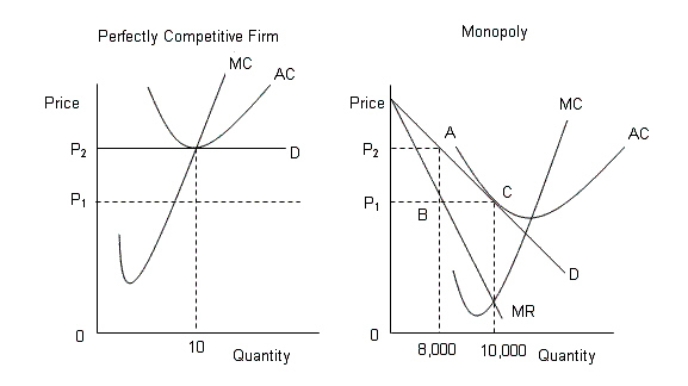 D: Average Revenue
AC: Average cost
MC: Marginal cost
MR: Marginal cost
Refer to Figure 24.7.If the perfectly competitive industry and the monopoly produces the same quantity, then:
Definitions:
Q5: When the U.S.dollar depreciates against other currencies:<br>A)foreign
Q6: The table given below reports the marginal
Q18: Firms in monopolistically competitive markets spend significant
Q27: A regulated monopoly is a monopoly which
Q34: When a good commodity is driven out
Q51: How many U.S.dollars does a U.S.importer need
Q75: One reason that monopolistically competitive firms often
Q96: Suppose a Japanese investor purchases a dollar
Q104: The following figures show the demand and
Q113: Scenario 22.2 Consider a publicly held firm