The figure given below shows the cost and revenue curves of a monopolist. Figure 24.9 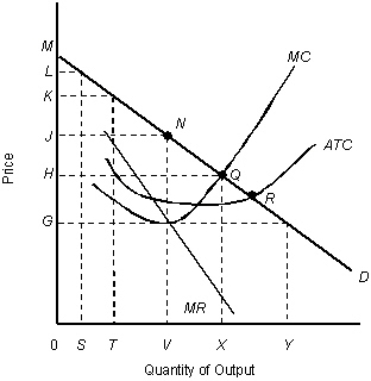 D: Average revenue
MR: Marginal revenue
ATC: Average total cost
MC: Marginal cost
In Figure 24.9, what is the consumer surplus at the profit-maximizing levels of output and price?
Definitions:
Direct Materials
Raw materials that are directly traceable and allocable to the production of specific goods or services.
Raw Materials Price Variance
The difference between the actual cost of raw materials and the standard cost multiplied by the actual quantity used.
Raw Materials Quantity Variance
The difference between the actual quantity of raw materials used in production and the estimated quantity, which can indicate inefficiencies or savings in material usage.
Materials Quantity Variance
The variance between the real amount of materials consumed in the manufacturing process and the anticipated amount, with this difference being multiplied by the per unit standard cost.
Q3: The table below shows the total cost
Q11: The table below shows the total cost
Q15: Monopsonists tend to exploit the resources as
Q18: If a firm in a perfectly competitive
Q20: A person who takes less care of
Q45: The figure given below depicts the demand
Q87: In general, the number of firms is
Q89: The market-demand curve for a product in
Q93: It is often impossible for a business
Q99: Under George W.Bush's administration, antitrust policy:<br>A)became much