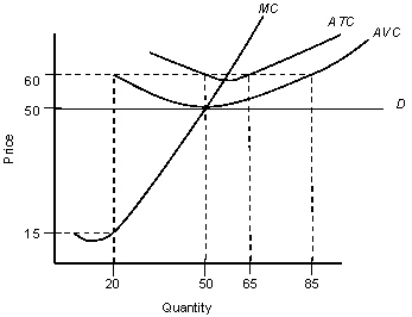
The figure given below shows the demand and cost curves of a perfectly competitive firm. Figure: 23.4  D: Demand curve
MC: Marginal cost curve
ATC: Average-total cost curve
AVC: Average-variable-cost curve
According to Figure 23.4, the firm's shutdown price is:
Definitions:
Extradeal Negotiations
Negotiations that occur outside of the main deal or agreement, often focusing on side issues or additional terms.
Contentious Situations
Scenarios characterized by disagreement, conflict, or controversy where parties have opposing opinions or interests.
Superordinate Goal
A goal that is important to all parties involved, transcending individual or group interests, and facilitating cooperative efforts.
Fractionating Conflict
The strategy of breaking down a larger conflict into smaller, more manageable components for easier resolution.
Q2: A zero economic profit is not a
Q42: An appreciation of the Norwegian kroner in
Q50: Regulation of enterprises by the government has
Q60: Which of the following statements about international
Q63: If the Herfindahl index for automobiles take
Q71: A fixed exchange rate can be an
Q75: Economies and diseconomies of scale are the
Q80: Under price discrimination, a monopolist equates the
Q117: The following figure shows revenue and cost
Q122: The opportunity cost of going to the