The figure given below shows the revenue and cost curves of a perfectly competitive firm. Figure 23.2 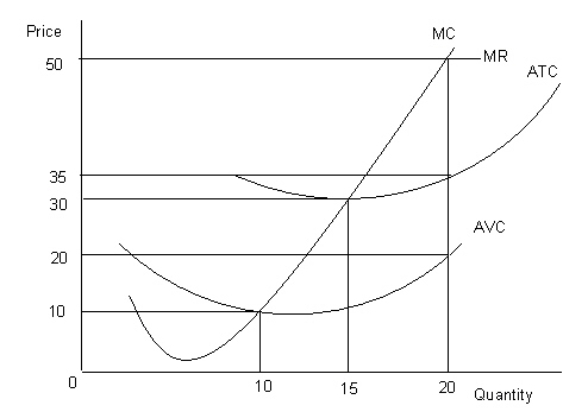 MC: Marginal cost curve
MR: Marginal revenue curve
ATC: Average-total-cost curve
AVC: Average-variable-cost curve
Refer to Figure 23.2.What is the profit-maximizing price and output level?
Definitions:
Q5: The figure given below shows the demand
Q10: After hiring a new employee, a manager
Q32: Suppose at a certain quantity of output,
Q58: Assume a U.S.firm invests $1, 500 to
Q70: If marginal revenue is greater than marginal
Q84: At long run equilibrium of a perfectly
Q99: The following figure shows the revenue and
Q103: Barriers to entry do not occur when:<br>A)economies
Q108: Typically, restrictions to "save domestic jobs" simply
Q128: If a dollar invested in the United