The following figure shows the cost and revenue structures of a firm.MC represents the marginal cost curve, AC represents the average cost curve, AR represents the average revenue curve, and MR represents the marginal revenue curve.P* is the equilibrium price and Q* is the equilibrium output. Figure 22.5 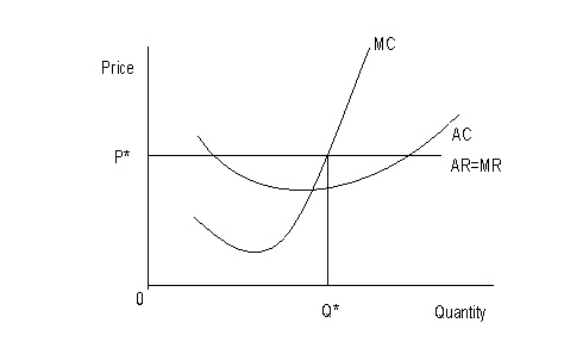 Refer to Figure 22.5.Identify the market structure in which the firm operates:
Definitions:
Interpersonal Demands
The pressures and challenges associated with interactions between individuals in a workplace or social setting.
Group Pressures
The influence exerted by a group on its members to conform to its norms, values, and behaviors.
Leadership Style
Refers to the behaviors and methods leaders use to inspire, influence, and direct their teams towards achieving set objectives.
Task Demands
Aspects of a job that involve specific tasks, work content, and work environment requiring physical and mental effort by the employee.
Q31: Suppose you are a U.S.exporter expecting to
Q59: Economic efficiency is achieved when the price
Q65: When the exchange rate fluctuates around a
Q71: A fixed exchange rate can be an
Q82: Interest rate parity can be summarized by
Q100: The greater the differentiation among products of
Q104: When the U.S.dollar depreciates in relation to
Q108: What is the interest rate on a
Q113: Grocery store coupons, mail-in rebates, senior discounts,
Q132: The figure given below shows the demand