The following graph shows the demand and cost curves of an imperfectly competitive firm.MC and ATC represent the marginal cost curve and the average cost curve respectively. Figure 22.1 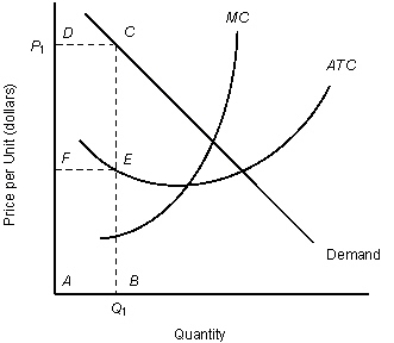 Refer to Figure 22.1.At price P1 the firm sells quantity Q1, and total cost is shown by:
Definitions:
Media Technology
Refers to the tools and platforms used for creating, disseminating, and consuming content, impacting how information is shared and perceived.
Social Movements
Collective, organized campaigns aimed at achieving a particular social, political, economic, or cultural goal, often outside of institutionalized political channels.
Marginal
Positioned at the fringe or edge, often referring to groups or individuals that are considered outside the mainstream of society or economically and socially disadvantaged.
Socially Engaged
Active participation in community or societal issues and efforts to promote social change.
Q14: When an exchange rate is established as
Q23: The table given below shows the prices
Q38: The table given below shows the total
Q39: The table given below shows the price,
Q62: If marginal product increases with an increase
Q73: A permanent shift in the foreign exchange
Q73: The table given below shows the price
Q81: Assume an Australian importer expects to pay
Q96: Which of the following was the reserve
Q116: The marginal revenue curve of a firm