The figure given below depicts the foreign exchange market for British pounds traded for U.S.dollars. Figure 22.2 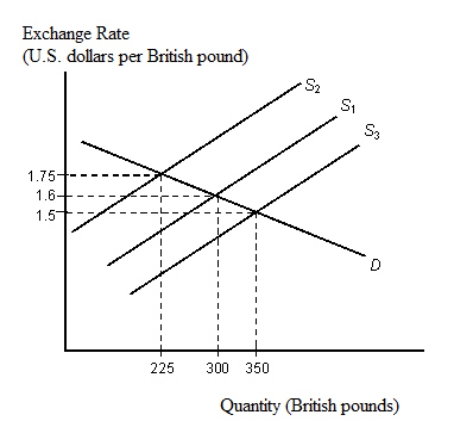 Refer to Figure 22.2.An increase in the equilibrium quantity of British pounds from 300 to 350 would most likely mean that:
Definitions:
Tail Risk
Risk of extreme events in the far tail of the probability distribution.
Worst-case Scenario
A situation where the most unfavorable conditions lead to the worst possible outcome for a project or investment.
Downside Exposure
The potential loss in value of an investment due to market declines, highlighting the risk in bearish scenarios.
VaR (Value At Risk)
A statistical technique used to measure and quantify the level of financial risk within a firm or investment portfolio over a specific time frame.
Q6: Perfect competition is the only market structure
Q10: Assume that a British investor buys a
Q21: An upward-sloping supply curve of Korean won
Q46: Creating conditions for fair trade by limiting
Q64: The figure given below shows the revenue
Q65: For a monopolist with a linear demand
Q73: The following figures show the demand and
Q106: The figure given below shows the demand
Q114: The exchange rate that is established in
Q119: Suppose a U.S.citizen purchases a one-year Norwegian