The figure given below shows cost curves of a firm. Figure: 21.2 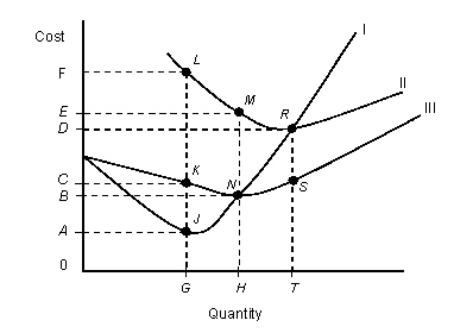 In the figure,
|: Marginal cost curve
||: Average total cost curve
|||: Average variable cost curve
Refer to Figure 21.2.At an output level of H, average total cost is:
Definitions:
U.S. Bureau of Labor Statistics
A federal agency that collects and analyzes essential economic information related to labor market activity, working conditions, and price changes in the economy.
American Companies
refer to business enterprises based in the United States, known for their influence on the global economy and innovation in various sectors.
Overseas Companies
Businesses that operate outside their home country, engaging in international trade or services.
Discrimination
Your behavior, or what you do (or intend to do, or are inclined to do) as a result of your stereotypes and prejudice.
Q20: Appreciation of the dollar means that now
Q29: The figure given below depicts the demand
Q33: Suppose that for 20 bicycles, the total
Q40: Which of the following may lead to
Q46: The table given below shows the price
Q53: In effect, during the period immediately following
Q64: If an infant industry truly has a
Q67: Goodspeed Automobiles manufactures 100 disc brake cylinders.At
Q75: The following figure shows the revenue and
Q100: Firms in industrial countries find a larger