The figure given below depicts the demand and supply of Brazilian reals in the foreign exchange market.Assume that the market operates under a flexible exchange rate regime. Figure 21.1 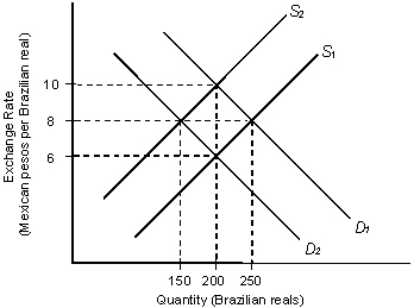 In the figure:
D1 and D2: Demand for Brazilian reals
S1 and S2: Supply of Brazilian reals
Refer to Figure 21.1.If the initial equilibrium exchange rate is 6 pesos per real, then other things equal, a decrease in the number of Brazilian tourists to Mexico would:
Definitions:
Marginal Revenue
The additional revenue that a firm receives from selling one more unit of a good or service.
Price Discrimination
A pricing strategy where identical or substantially similar goods or services are sold at different prices by the same provider in different markets or to different buyers.
Economic Profits
The difference between total revenues and total costs, including both explicit and implicit costs, indicating the financial gain realized when accounting for opportunity costs.
Demand Schedule
A table that lists the quantity of a good all consumers in a market will buy at every different price.
Q8: According to Table 6.2, marginal utility is
Q10: An appreciation of the Norwegian kroner in
Q43: How many U.S.dollars does a U.S.importer need
Q87: If average variable cost is falling, then:<br>A)average
Q95: If long-run costs are plotted on the
Q96: Which of the following was the reserve
Q102: Assume a U.S.firm invests $1, 500 to
Q104: The figure below shows the demand (D)and
Q108: What is the interest rate on a
Q114: The table below shows the total utility