The data in the table below assumes that with the same quantity of resources, both Australia and Philippines produces food and computers.Australia can make 1, 000 computers or 2, 000 units of food in a day, and the Philippines can make 200 computers or 1, 200 units of food in a day. Table 20.2 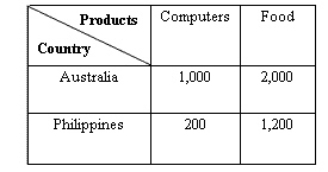 According to Table 20.2, what is the opportunity cost of 1 unit of food in Australia?
Definitions:
Scatterplot Strength
Indicative of the degree of correlation between two variables represented in a scatterplot, showing how closely the data points fit a trend line.
Curve Following
The practice of tracing the path or line that best fits the pattern of a dataset, often used in trend analysis.
Sample Variance
The measure of variation or spread within a sample set of data, calculated by averaging the squared deviations from the sample mean.
Population Variance
A measure of the dispersion of a set of data points in a population from their mean value, representing how spread out the population values are.
Q22: The fact that the United States exports
Q23: The product life cycle theory of comparative
Q34: Scenario 20.1 Suppose labor productivity differences are
Q40: Suppose a U.S.importer agrees to pay a
Q54: Suppose the production of helicopters is an
Q69: In 1992 the EEC was replaced by
Q92: Suppose that the price of an ounce
Q108: The effect of an import quota on
Q109: The prices that people are willing to
Q109: The oldest theory of comparative advantage is