Multiple Choice
The figure given below depicts the negatively sloped demand and positively sloped supply curves of wheat in a country. Figure 20.2 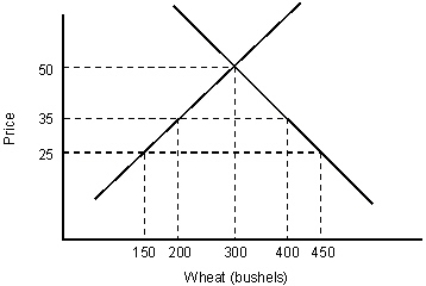 In Figure 20.2, if the world price per bushel of wheat is $25, and a tariff of $10 is imposed, what is the domestic production?
Definitions:
Related Questions
Q2: Which of the following counties are largely
Q8: Which of the following tax structures creates
Q22: The export supply curve shows a country's:<br>A)domestic
Q26: "Throwing good money after bad" is also
Q29: Mr.Rational has $27 that he plans to
Q47: If the demand for cream cheese produced
Q59: Foreign exchange market intervention is most effective
Q72: In reality international trade is determined solely
Q92: Suppose that the price of an ounce
Q98: The figure given below depicts the demand