Multiple Choice
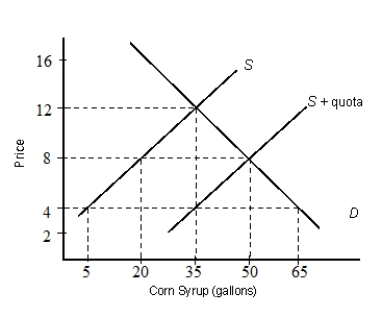
The figure below shows the demand (D) and supply (S) curves of corn syrups.Figure 21.3
-Which of the following can be considered as a cultural barrier to trade?
Definitions:
Related Questions
Q27: The figure given below depicts the foreign
Q36: The first panel in the following figure
Q41: The figure below shows the demand (D)and
Q46: The data in the table below assumes
Q73: The original comparative advantage model that used
Q76: We benefit from trade if we are
Q77: If a dinner guest was serious when
Q90: The figure given below shows three Short
Q101: In utility analysis, it is assumed that
Q107: The comparative advantage in a specific good