Multiple Choice
The below figure shows the various combinations of the goods X and Y that yield different levels of utility. Figure 6.3 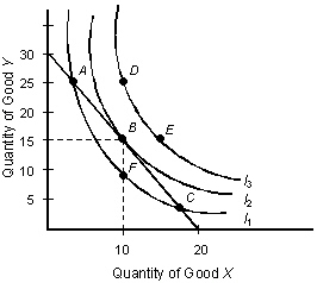 Refer to Figure 6.3.What combinations of X and Y are attainable by the consumer?
Definitions:
Related Questions
Q4: It seems self evident that countries would
Q26: Which of the following stands true for
Q31: Scenario 20.2 Suppose labor productivity differences are
Q33: The figure given below depicts the negatively
Q54: If prices rise within a country, then,
Q61: After the U.S.government had approved the feeding
Q64: If the world price of a good
Q66: Which of the following is one of
Q79: _ taxes have risen more rapidly in
Q114: The figure below shows two Lorenz curves,