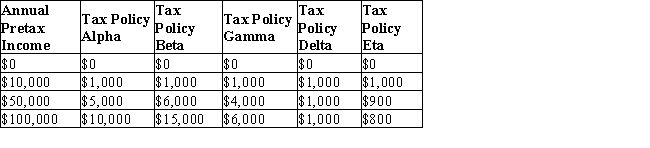
The table given below shows the absolute tax amounts under five different tax policies for respective income levels.Table 19.2
-Those who argue that welfare programs are a drag on the economy are of the view that welfare programs funded by taxes:
Definitions:
Induced Consumption
Consumer spending that varies with income, representing the portion of income that households spend on goods and services rather than saving.
Disposable Income
Income available to households for the strategies of saving and spending after tax deductions.
Billion
A Billion is a numerical value equivalent to one thousand million (1,000,000,000) in the American short scale, commonly used in financial and demographic contexts.
Saving
The portion of income that is not spent on consumption or taxes, often set aside for future use or investment.
Q4: If the owner of a nonrenewable resource
Q12: The data in the table below assumes
Q18: International equilibrium occurs if the quantity of
Q28: According to empirical observations, the cost of
Q35: Which of the following is not considered
Q58: The Taiwanese government allows tax credits for
Q88: Many economists believe that the collapse of
Q109: In Country X, the highest 10 percent
Q111: Scenario 20.1 Suppose labor productivity differences are
Q120: With an increase in income, the consumer