The figure given below shows the demand curves for dollars arising out of Thai demand for U.S.goods and services and the supply of dollars arising out of the U.S.demand for Thai goods, services, and financial assets.D1 and S1 are the original demand and supply curves. Figure 18.1 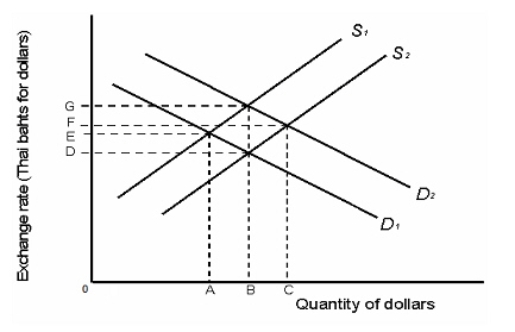 Refer to Figure 18.1.The original equilibrium exchange rate is _____.
Definitions:
Q7: Import substitution is the only strategy used
Q7: Which of the following best explains the
Q13: The demand for mansions is elastic because
Q16: In 2000, the real GDP for Malaysia
Q42: Why does the census data overstate inequality?<br>A)They
Q54: In the opinion of many consumers, there
Q70: If people expect the price of a
Q74: A part of the supply to the
Q88: Compute the actual investment in a mutual
Q104: A major problem with household data is