The figure given below represents demand for and supply of hospital beds in Anytown, U.S.A. , as shown by curves D and S1 in the following figure.If the hospital receives permission to expand, its new supply curve will be S2.Price level P1 is the fixed prospective payment reimbursement rate paid by Medicare to the hospital, regardless of actual cost. Figure 18.3 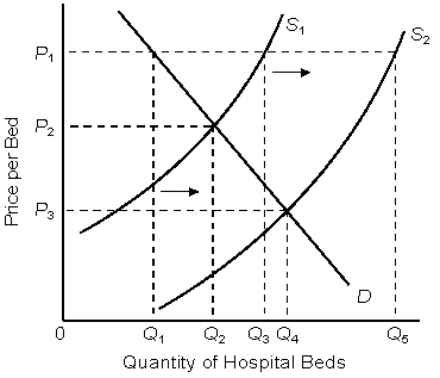 According to Figure 18.3, the surplus of beds caused by the fixed reimbursement rate, before the hospital expansion, is the difference between _____ and _____.
Definitions:
Carrying Costs
Carrying costs are the total expenses associated with holding or storing inventories over a certain period.
Set-Up Costs
Initial expenses incurred during the establishment of a new business or production line, including equipment and installation fees.
Storage Costs
Expenses associated with keeping goods in a warehouse or storage facility until they are sold or used.
Economic Order Quantity (EOQ)
A formula that calculates the optimal order size to minimize the total costs associated with purchasing, receiving, and holding inventory.
Q8: If the percentage change in quantity demanded
Q11: Per capita real GDP is a questionable
Q12: During the stock market bubbles, the price/earnings
Q14: Getting the work done by some other
Q26: The people of Andres, a small fishing
Q37: The figure below shows the demand (AD)and
Q43: The host country's balance-of-payments problem tends to
Q59: If butter has an income elasticity equal
Q69: Income distribution across the world is highly
Q92: Jen considers smoking an inferior good.In other