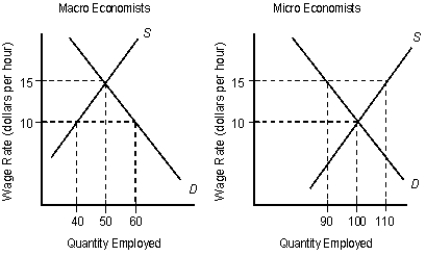
The following figures show the demand (D) and supply (S) curves of micro and macro economists.Figure 16.6

-The greater the opportunity cost of any particular occupation, the smaller the number of people who will select that occupation.
Definitions:
Supply
The sum of a certain item or service that consumers can obtain.
Equilibrium Quantity
The quantity of goods or services supplied that is equal to the quantity demanded at the market price.
Equilibrium Price
The market price at which the quantity of goods supplied is equal to the quantity of goods demanded, resulting in no surplus or shortage.
Supply Increases
A condition in which the quantity of goods and services offered by businesses rises, often leading to lower prices if demand remains constant.
Q14: Long-term economic growth requires a permanent:<br>A)decline in
Q15: Monetarists would argue that in the short
Q38: Labor productivity is measured as:<br>A)the share of
Q51: Which of the following is considered a
Q63: Which of the following determines comparable worth
Q66: Sometimes the only information that is available
Q73: The American Medical Association helps increase:<br>A)price competition
Q75: The following table shows the total output
Q84: Risk is typically measured:<br>A)by comparing the size
Q110: Firms are consumers and households are the