Multiple Choice
The figure given below represents equilibrium in the labor market. Figure 14.5 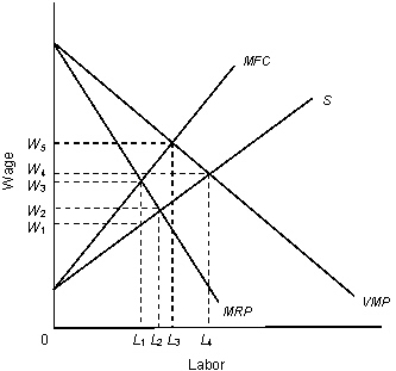 In the figure,
VMP: Value of marginal product curve
MRP: Marginal revenue product curve
MFC: Marginal factor cost
S: Supply curve of labor
Refer to Figure 14.5.What wage rate will this firm pay?
Definitions:
Related Questions
Q30: If a person is earning $80, 000
Q34: Which of the following may be explained
Q67: The figure given below shows the Phillips
Q78: The phrase, "Google stock soared Friday, continuing
Q80: Capital shallowing occurs because old capital depreciates,
Q97: Which of the following is a measure
Q99: The fixed amount that the issuer of
Q114: A leftward shift in the money demand
Q116: The transactions demand for money exists because:<br>A)people
Q122: Which of the following is the most