The figure below shows the demand and supply curves in the market for elementary education. Figure 13.1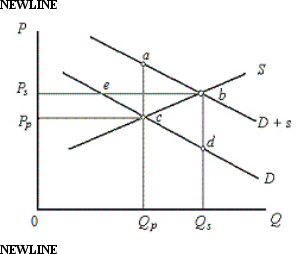 In the figure,
D: Private demand curve for elementary education
D + s: Demand curve which includes public benefits
S: Supply curve of education
Price and Quantity have been taken on vertical and horizontal axes respectively.
According to Figure 13.1, the outcome of an unregulated, unsubsidized market would be:
Definitions:
Producer Surplus
The difference between what producers are willing to accept for a good or service versus what they actually receive in the market.
Allocative Efficiency
A state of resource allocation where goods and services are distributed according to consumer preferences in a way that maximizes utility.
External Benefits
Advantages that result from a product or service's use that affect someone other than the direct consumer or producer, often justifying government intervention.
Consumption
The process by which goods and services are used by households and individuals, leading to a decrease in their availability.
Q6: The key feature due to which unexpected
Q17: Ceteris paribus, if the U.S.federal government reduces
Q36: Firms in monopolistically competitive markets spend significant
Q41: Assume that the reserve requirement is 10
Q54: According to the new Keynesian school of
Q70: If a resource can be put to
Q90: Which of the following is an example
Q92: In long-run equilibrium, each monopolistically competitive firm
Q94: Which of the following is most likely
Q107: The value of the marginal product of