The figure below shows the demand and supply curves in the market for elementary education. Figure 13.1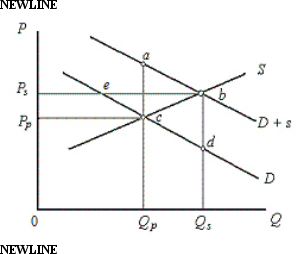 In the figure,
D: Private demand curve for elementary education
D + s: Demand curve which includes public benefits
S: Supply curve of education
Price and Quantity have been taken on vertical and horizontal axes respectively.
Figure 13.1 represents a situation of:
Definitions:
Black-Scholes Model
A mathematical model used for pricing European-style options and assessing the options' market value based on factors such as volatility, risk-free rate, and time to expiration.
Exercised
Refers to the act of implementing the rights granted by a financial contract, commonly in options trading where a buyer may execute the option.
Hedge Ratios
Financial ratios used to calculate the optimal amount of exposure needed to hedge (protect against risk) a position or portfolio.
Long Calls
An option strategy involving the purchase of call options, giving the buyer the right, but not the obligation, to purchase a security at a specified price within a certain time frame.
Q8: A firm that was initially a monopsonist
Q17: In fractional reserve banking:<br>A)bank assets are less
Q17: If the tax rate increases with an
Q23: Which of the following is true of
Q26: If the price level falls as real
Q45: If the resource market is perfectly competitive:<br>A)the
Q46: Suppose the wheat industry is in long-run
Q67: A market failure occurs when:<br>A)the market outcome
Q68: Assume that French budget deficits have raised
Q90: Monetary reform is a new monetary policy