The figure below shows revenue and cost curves of a natural monopoly firm. Figure 12.1 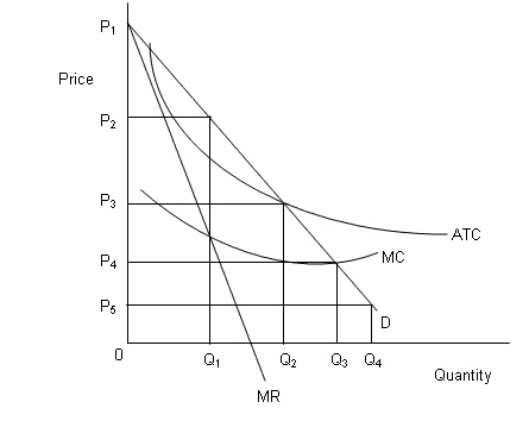 In the figure,
D: Demand curve
MR: Marginal revenue curve
MC: Marginal cost curve
ATC: Average total cost curve
Refer to Figure 12.1.If the regulatory agency sets the fair-rate-of-return price, the monopolist will:
Definitions:
Reviewers
Individuals who evaluate or critique products, services, literature, or academic works, often providing feedback or ratings to guide potential consumers or users.
Uniformity
The quality or state of being the same in form, appearance, or character; often signifies consistency across various elements of a brand or product.
Deadly Sins
A term often used figuratively to describe the most serious mistakes or pitfalls in a particular context.
No Consequences
A situation where actions do not result in any significant repercussions or penalties.
Q4: Suppose workers do not believe the Fed
Q21: The use of money as a medium
Q41: Assume that the reserve requirement is 10
Q50: The figure given below shows the demand
Q50: The table given below shows the levels
Q54: If a market becomes deregulated and is
Q57: When the Federal Open Market Committee buys
Q88: Being a monopoly or attempting to monopolize
Q114: When a good is subsidized by the
Q120: Suppose an appreciation of the French franc